When I talk to sellers about product performance, the conversation usually starts with a familiar set of metrics:
- •gross margin, and
- •"ROI" (often used to mean markup calculated as the ratio of gross profit to the COGS (cost of goods sold), sometimes including storage and other direct inventory-related costs).
These numbers are useful.
They show how much you earn per unit and how attractive a product looks relative to what you pay for it and to what you spend to keep it in stock.
But they all share one common limitation: They say how much, but almost nothing about how long.
A product that generates good profit relative to its cost and storage fees can still be a weak investment if the money is locked in that product for too long.
From a financial point of view, every purchase of inventory is an investment.
And any investment has two sides:
- •the result (profit), and
- •the time during which your capital is not available for anything else.
Most popular e-commerce metrics describe the first part quite well. The second part — time — is often left in the background.
That is exactly what the Cash Conversion Cycle (CCC) brings back into the picture.
A simple analogy: if this were a bank term deposit...
Think about how you look at a bank term deposit. You would never evaluate it only by interest rate.
You always ask: "For how long am I locking my money?"
5% for one month and 5% for one year are not the same offer.
The percentage is identical, but the speed of capital rotation is completely different.
With inventory, the logic is the same, just less explicit.
You:
- Put money into stock,
- Wait while products are produced, shipped, stored and sold,
- Eventually get the money back when the marketplace or customer pays you.
Yet many decisions are made as if only the percentage mattered — margin or markup — and not the length of the cycle.
CCC is simply a way to ask the same question you would ask about a term deposit:
How many days pass between the moment I spend the money and the moment I get it back?
What CCC actually measures (without turning this into a finance lecture)
In formal terms, CCC combines three time intervals:
- •how long you take to pay your suppliers,
- •how long inventory stays in the system before being sold,
- •how long it takes to receive cash after the sale.
In the classic notation, it's written as:
CCC = DIO (Days Inventory Outstanding) + DSO (Days Sales Outstanding) − DPO (Days Payable Outstanding)
You don't need to memorise the abbreviations to understand the idea:
- •if goods stay in inventory longer, CCC becomes longer,
- •if marketplaces pay you later, CCC becomes longer,
- •if you can pay suppliers later, CCC becomes shorter.
A shorter CCC means your capital returns faster.
A longer CCC means you need more money to support the same level of sales.
That's all it is.
Why this matters more than margin alone
Imagine two products with similar gross margin and similar markup ("ROI" as sellers usually define it) — gross profit divided by product and storage costs.
On paper they look equally attractive.
But:
- •Product A goes through the full cycle in 40 days,
- •Product B takes 100 days from cash out to cash back.
If you treat them only as "20% ROI (Markup)" products, they seem comparable.
If you treat them as investments with different durations, they are very different.
With the same amount of capital, Product A allows you to complete more cycles per year.
Even if the per-unit profit is the same, the Expected Return On Investment (ROI) can be much higher simply because the money turns over more often.
This is what CCC exposes: not just whether a product is profitable, but how efficiently it uses your limited capital over time.
What the data actually shows
The chart below plots real product data, with net margin on the vertical axis and Cash Conversion Cycle on the horizontal axis. Each dot is one product.
The color shows performance relative to the cost of capital. Green dots — from light to dark — are products generating returns above the cost of capital, with darker shades indicating a stronger rank. Red dots fall below it. The same shade of green represents the same level of financial performance.
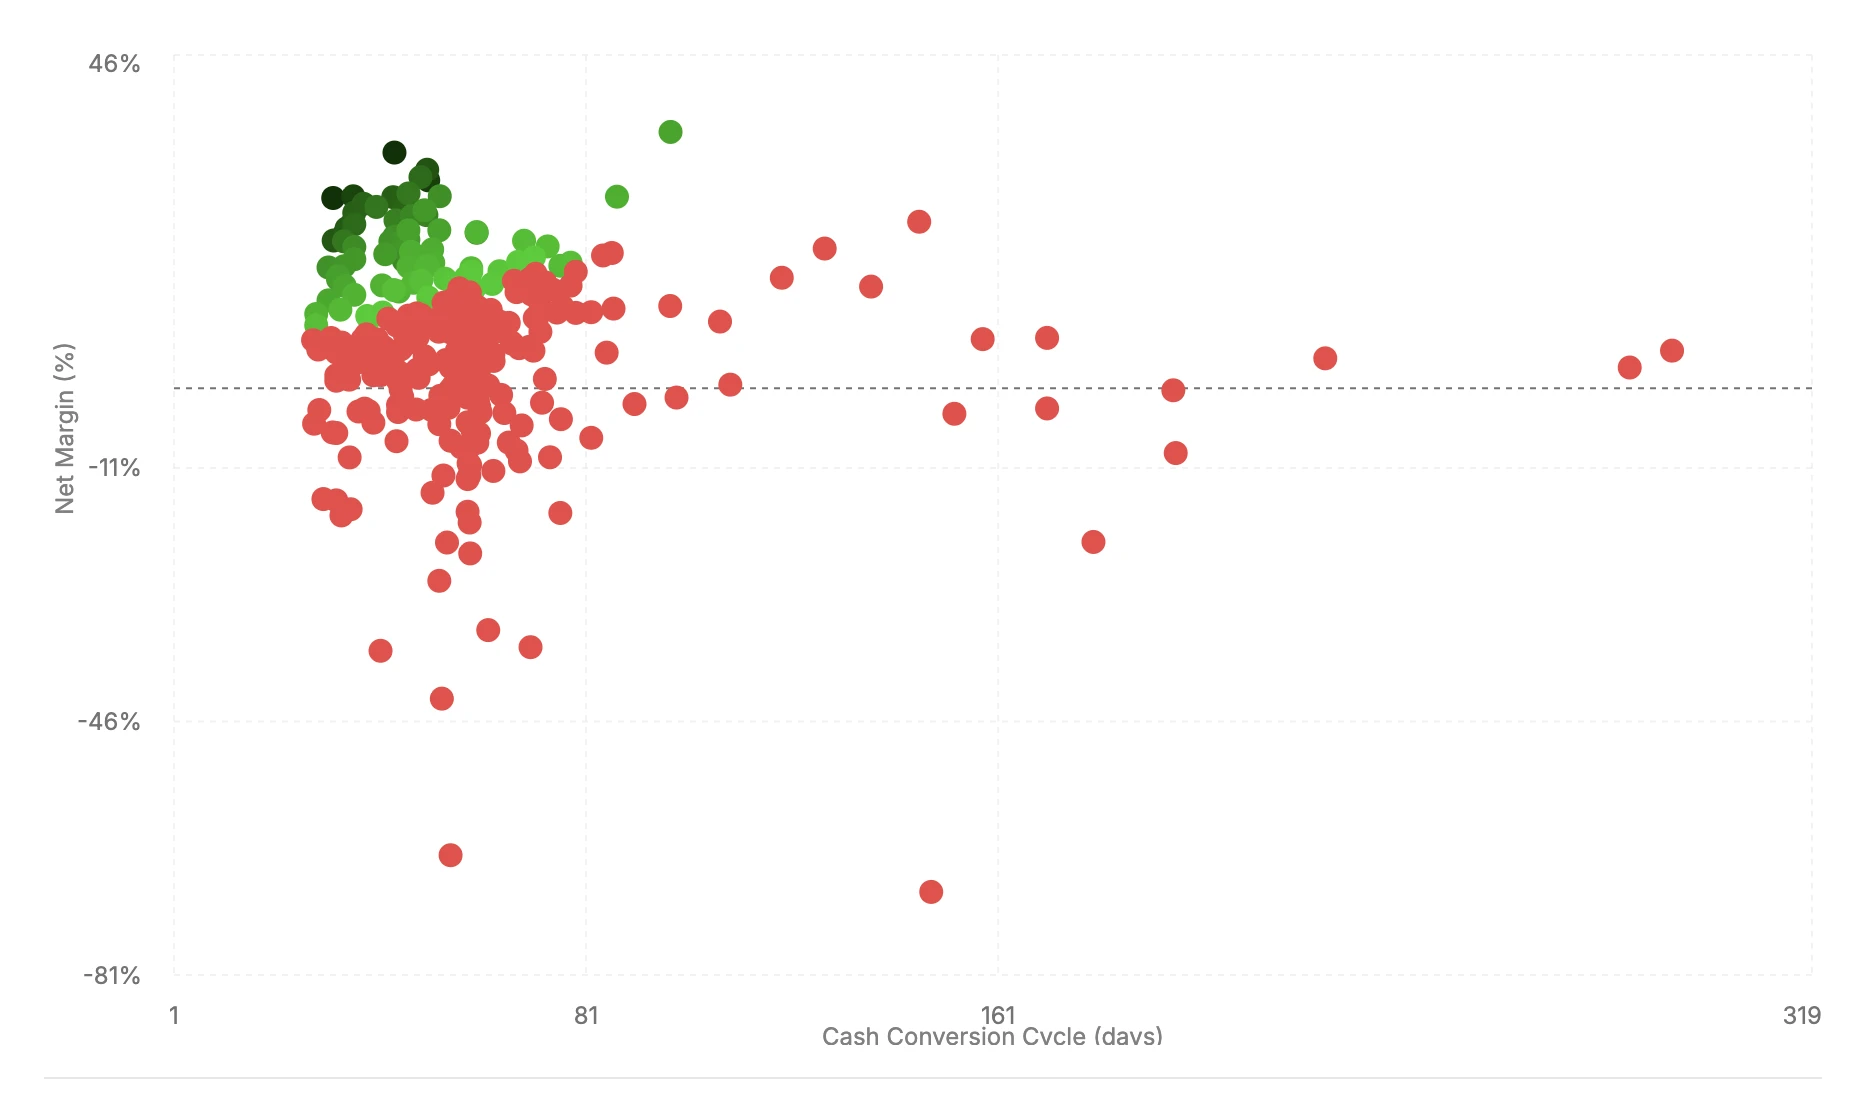
The first thing to notice is that dots of the same color appear at very different margin levels. The same financial performance can be reached with a higher margin and a slower cycle, or with a lower margin and a faster one.
The second thing is more important: products with similar margins do not all fall in the same color zone. A product at, say, 20% net margin can be green or red depending entirely on the length of its cash cycle.
This is what CCC adds to the picture. Margin tells you how much you earn per unit. CCC determines how many times per year that earning repeats. A product that earns less per cycle but completes it three times faster may generate more annual return on capital than one with a higher margin that turns over slowly.
The four quadrants of the chart tell a clear story:
- Top-left (high margin, short CCC): the best opportunities — profitable and capital-efficient.
- Top-right (high margin, long CCC): profitable but capital-intensive — you earn well, but need more working capital to sustain the same level of sales.
- Bottom-left (low margin, short CCC): thin margins but fast turnover — can still work if the cycle is short enough to compensate.
- Bottom-right (low margin, long CCC): the most difficult combination — worth improving or avoiding.
Why sellers often ignore the time factor
In my experience, it's rarely because they don't understand that time is important.
It's usually because few systems around them make this visible by default.
- •Marketplace dashboards show sales, fees, margin — not the age of money.
- •Restock tools focus on stockouts and storage, not on when cash leaves or returns.
- •"ROI" is often calculated as profit divided by cost, without any reference to time.
So sellers naturally focus on what they see:
- •good margin,
- •good "ROI" (markup),
- •good sales velocity.
And only when growth starts to put pressure on cash do they realise that the real constraint is not profit per unit, but how long working capital stays locked inside the cycle.
CCC is just a way to make this constraint visible earlier — before it becomes a problem.
The point of thinking in terms of CCC
The goal is not to turn every decision into a financial model.
The goal is to change one mental habit:
stop looking only at "how much", and start also asking "for how long".
Once you do that, many decisions start to look different:
- •A product with slightly lower margin but a much shorter cycle may turn out to be the better investment.
- •A supplier with slightly higher prices but much better payment terms may improve capital efficiency.
- •A marketplace with modest fees but very slow payouts may be more demanding on cash than it appears.
CCC is simply a structured way to capture this perspective.
It treats your products not just as items on a shelf, but as uses of capital competing for time.
In the previous article, we looked at why fast sales do not necessarily translate into fast cash due to settlement cycles.