A few days ago, I was speaking with a friend of mine, an Amazon seller who runs a sizeable business and tries to follow his restock recommendations as closely as possible. At some point he said something that I've heard many times:
"I stick to the recommended stock levels. Tools tell me what's 'healthy', how fast products sell, and when I need to reorder. I try not to hold anything longer than 60 days, that's what everyone advises."
This immediately reminded me of similar situations I worked on years ago with teams in large e-commerce companies, where we were dealing with the same underlying questions around inventory decisions and capital efficiency. What made the difference in those situations was looking at sales speed together with margin, not treating them as separate decisions.
Here’s why.
How Traditional Restock Tools Work And What They Assume
Most restock tools follow the same logic:
- Define a recommended inventory level.
- Estimate how fast this inventory will be consumed.
- Factor in lead time to calculate reorder dates and quantities.
- Aim to avoid stockouts and excessive storage.
In other words, their implicit objective is to keep the target inventory turnover.
Operationally, this makes sense:
Buy and hold what sells, at approximately the rate it sells.
But this logic has built-in limitations that become visible once you look at inventory through a financial lens, not only an operational one.
Where This Approach Breaks: Identical Rules For Fundamentally Different Products
Here's a simple question.
Which product is "better"?
- •Product A, which stays in stock for 60 days on average,
- •Product B, which stays for 100 days?
Most people (including my friend) would say: Product A, because it turns faster.
But what if Product B generates ten times more profit per unit, even after storage fees? Suddenly, the comparison is no longer straightforward.
If you had to invest in only one of them assuming you have capital constraints, which SKU should receive your capital?
This is where many sellers realize that the standard operational logic doesn't answer the financial question.
Clear Answers Exist Only In One Simple Case
The decision is obvious only when one product is better on both dimensions. If A turns faster and has higher margin, A is better. But the moment one product turns faster while the other has higher margin, which is exactly what happens in real life, the comparison becomes non-trivial.
Let's consider an example where we look at just these two factors in isolation from everything else.
Assume we can sell a product throughout the year, and each time it sells, we set the profit aside rather than reinvesting it back into the same product.
We know, for example, that a 50% margin means $1 of profit for every $1 invested.
Then, if the turnover is 60 days, we can roughly sell this product about 6 times per year and earn $6 in profit.
Let's visualize this in a matrix for several combinations. The columns represent different Inventory Turnover values, the rows represent Margin, and the cells show the expected annual profit.
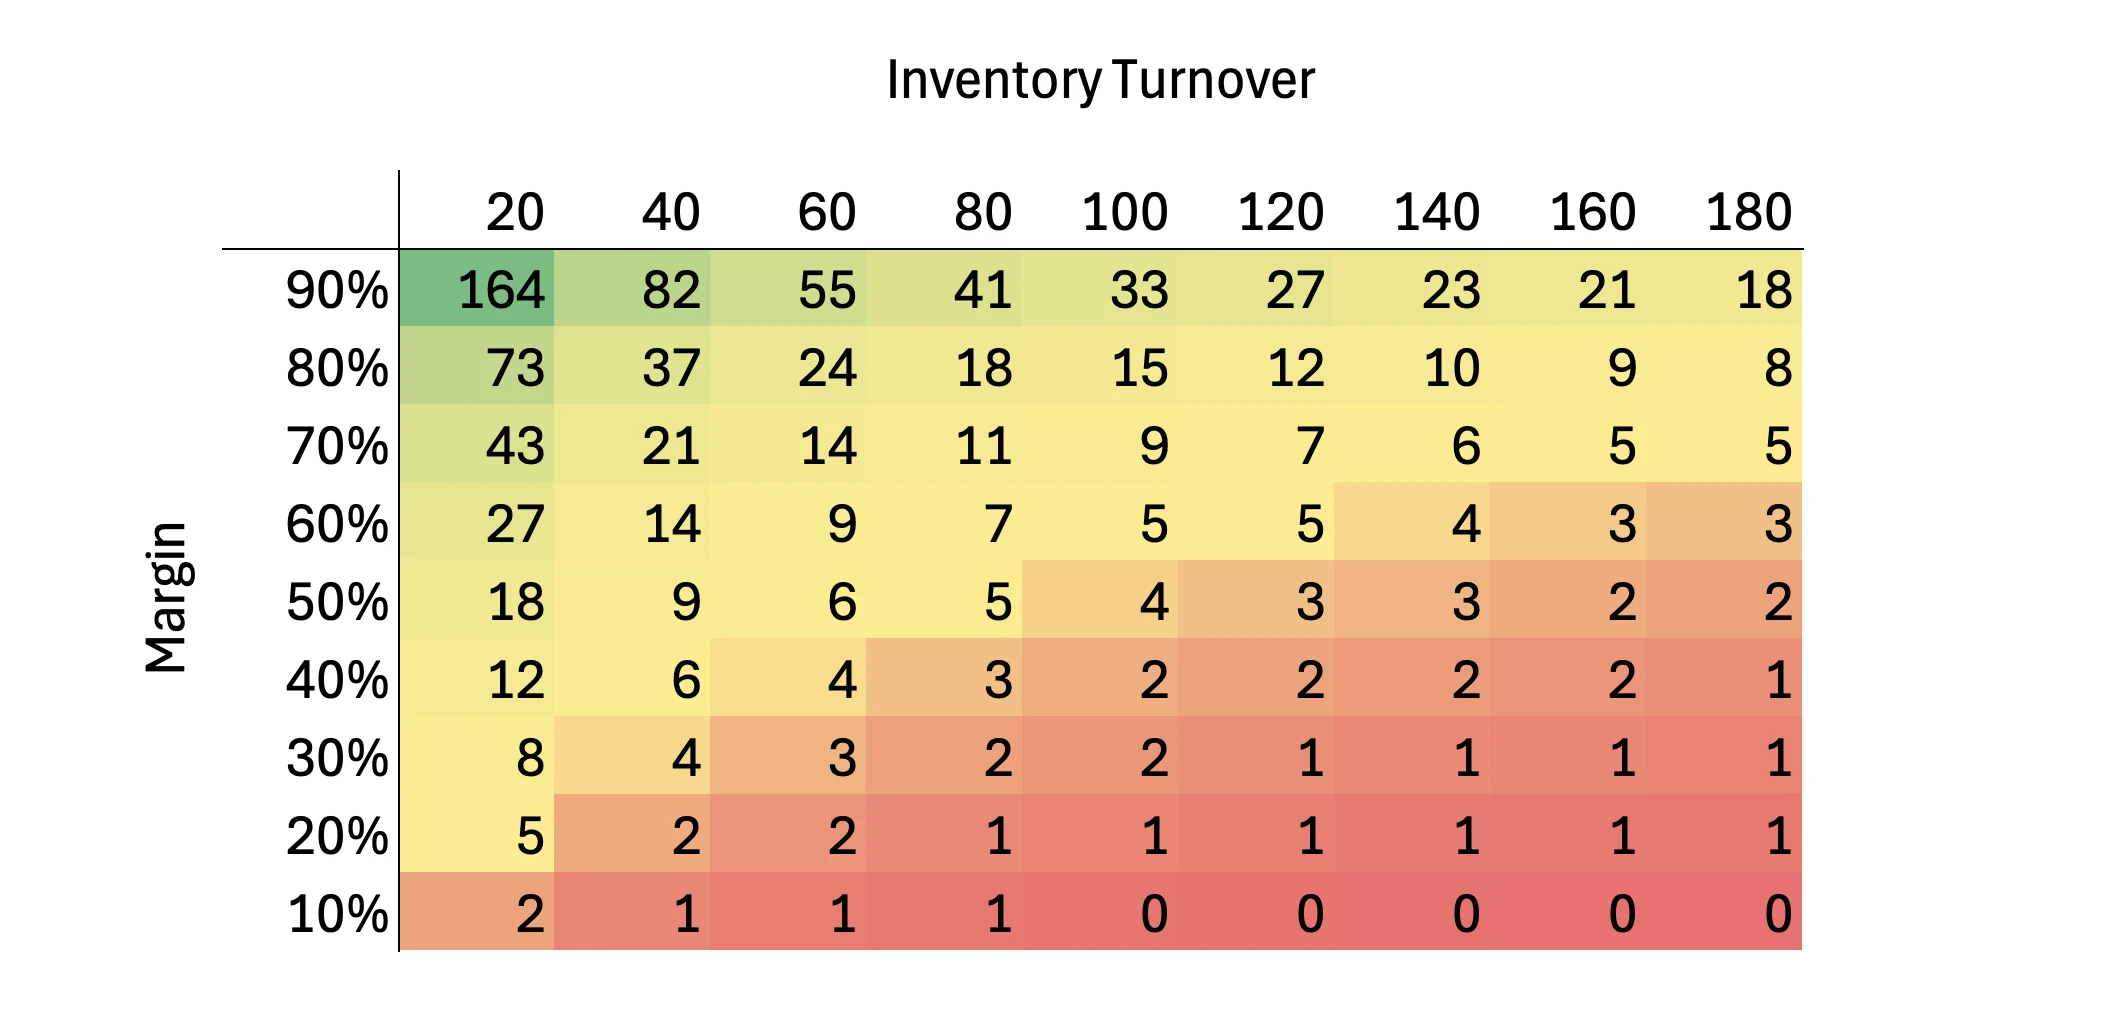
We can see, for example, that the following combinations produce the same result as our 60-day, 50% margin case: 40-day turnover with 40% margin, and 140-day turnover with 70% margin. Note that 140 days is more than twice as slow as the commonly recommended 60-day turnover.
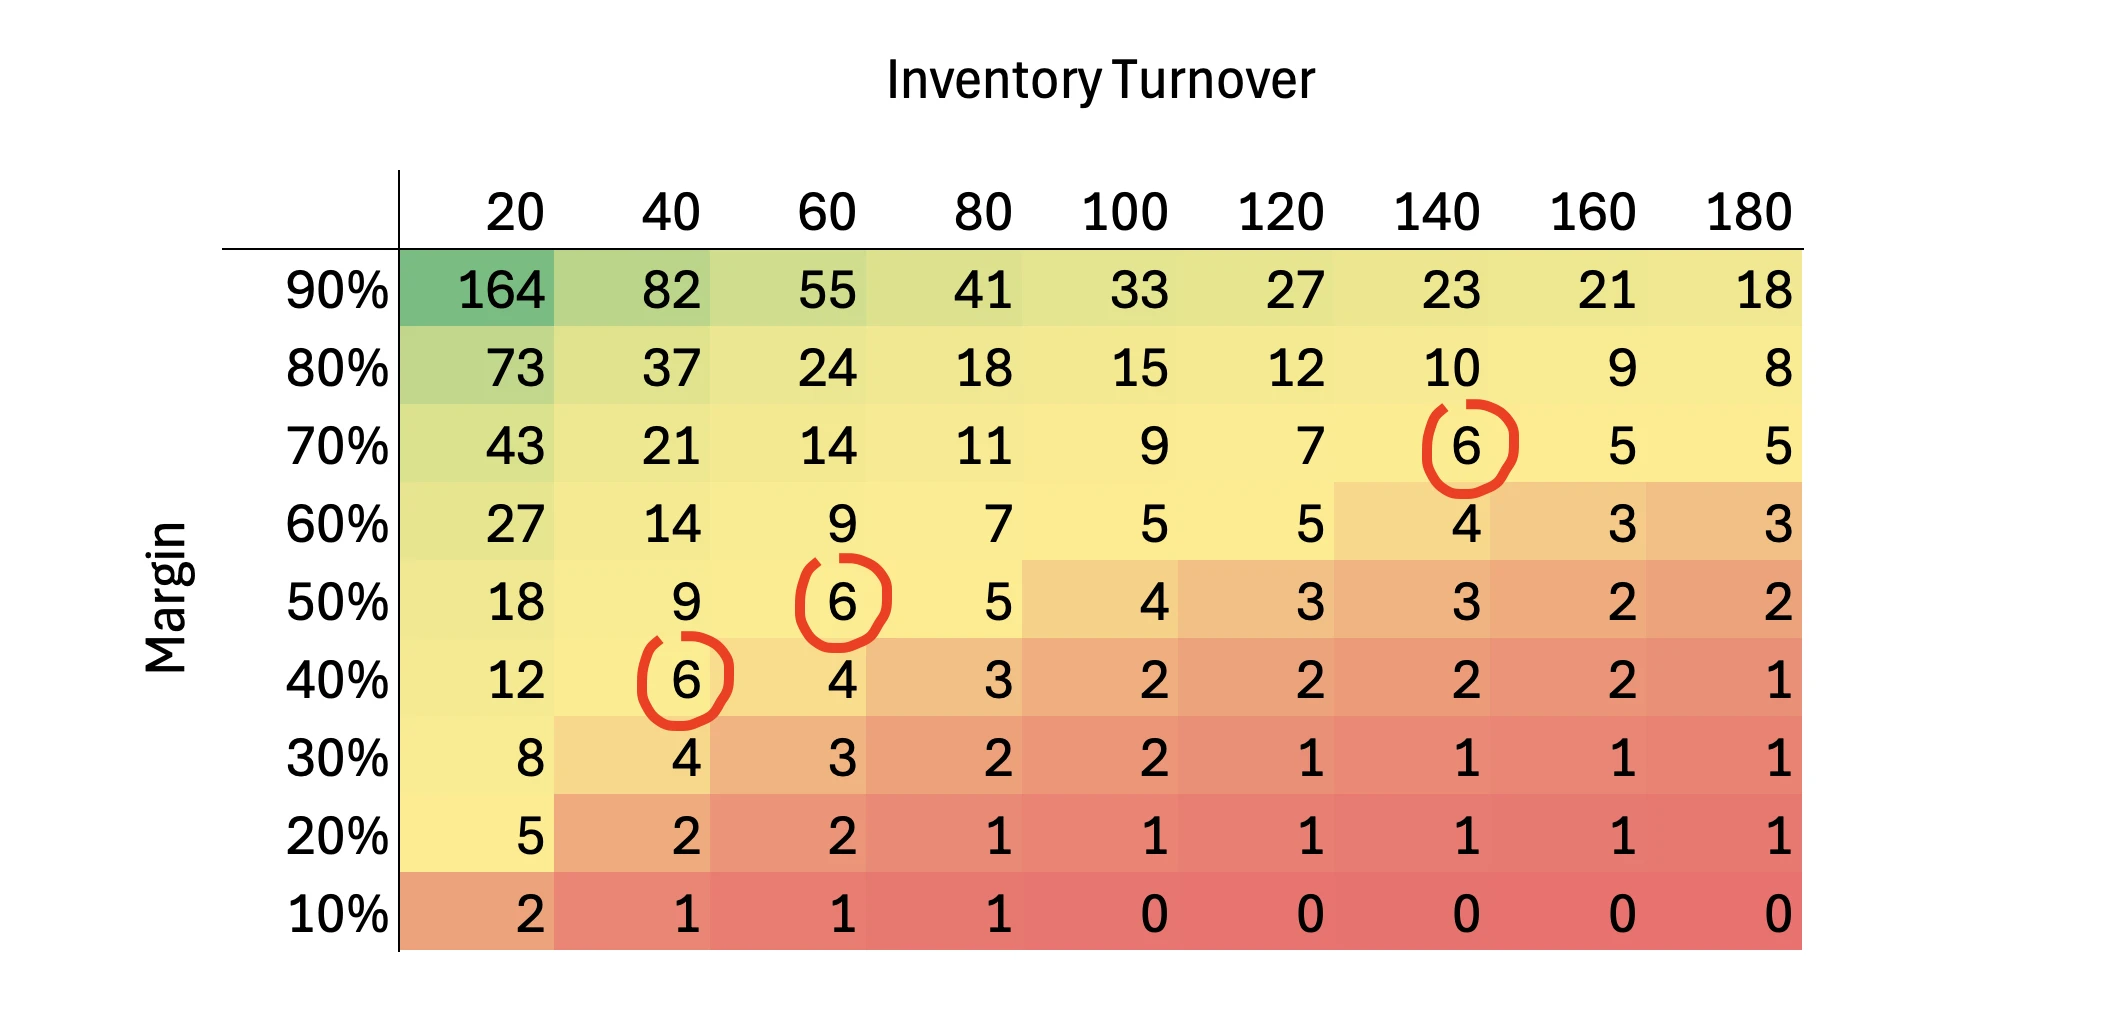
If we return to our example with Product A (60-day turnover) and Product B (100-day turnover), we can see that, all else being equal, Product B beats Product A in many cases. For example:
- •product with 100 days turnover and 90% margin beats product with 60 days turnover and margins 80% and below,
- •product with 100 days turnover and 80% margin beats product with 60 days turnover and margins 70% and below,
- •product with 100 days turnover and 70% margin beats product with 60 days turnover and margins 50% and below,
- •product with 100 days turnover and 60% margin beats product with 60 days turnover and margins 40% and below,
- •product with 100 days turnover and 50% margin beats product with 60 days turnover and margins 30% and below,
- •product with 100 days turnover and 40% or 30% margin beats product with 60 days turnover and margins 10% and below.
You cannot say which SKU is "better" until you understand how margin and turnover interact. This interaction is precisely what operational tools tend to ignore.
What About ABC Analysis? Doesn't It Solve This?
Some sellers sometimes say:
"We already use ABC analysis. That's how we categorize products and decide what deserves attention."
That is true. ABC analysis or ABCXYZ analysis is a legitimate and useful tool. It helps identify the small group of products that contribute the most to the business. It's a structured way to focus on what matters.
Nevertheless it has a fundamental limitation that often goes unnoticed:
ABC analysis ranks products across the entire catalog, but it doesn't help you choose between products within the same class.
And this is where the real decisions happen.
To illustrate, let's apply the ABCXYZ analysis approach to our problem.
Standard ABCXYZ analysis is typically structured as follows:
- •ABC ranks products by their contribution to profit or revenue (margin works well as a proxy).
- •XYZ ranks products by demand stability (coefficient of variation).
But here we are only looking at margin (%) and turnover (days). So we apply the principles of the method adaptively:
- •ABC by margin level (higher % = higher class).
- •XYZ by turnover speed (fewer days = "more stable" and better, like X).
Let's define the following classes for our example:
Margin (ABC):
- •A (high):70–90%
- •B (moderate):40–60%
- •C (low):10–30%
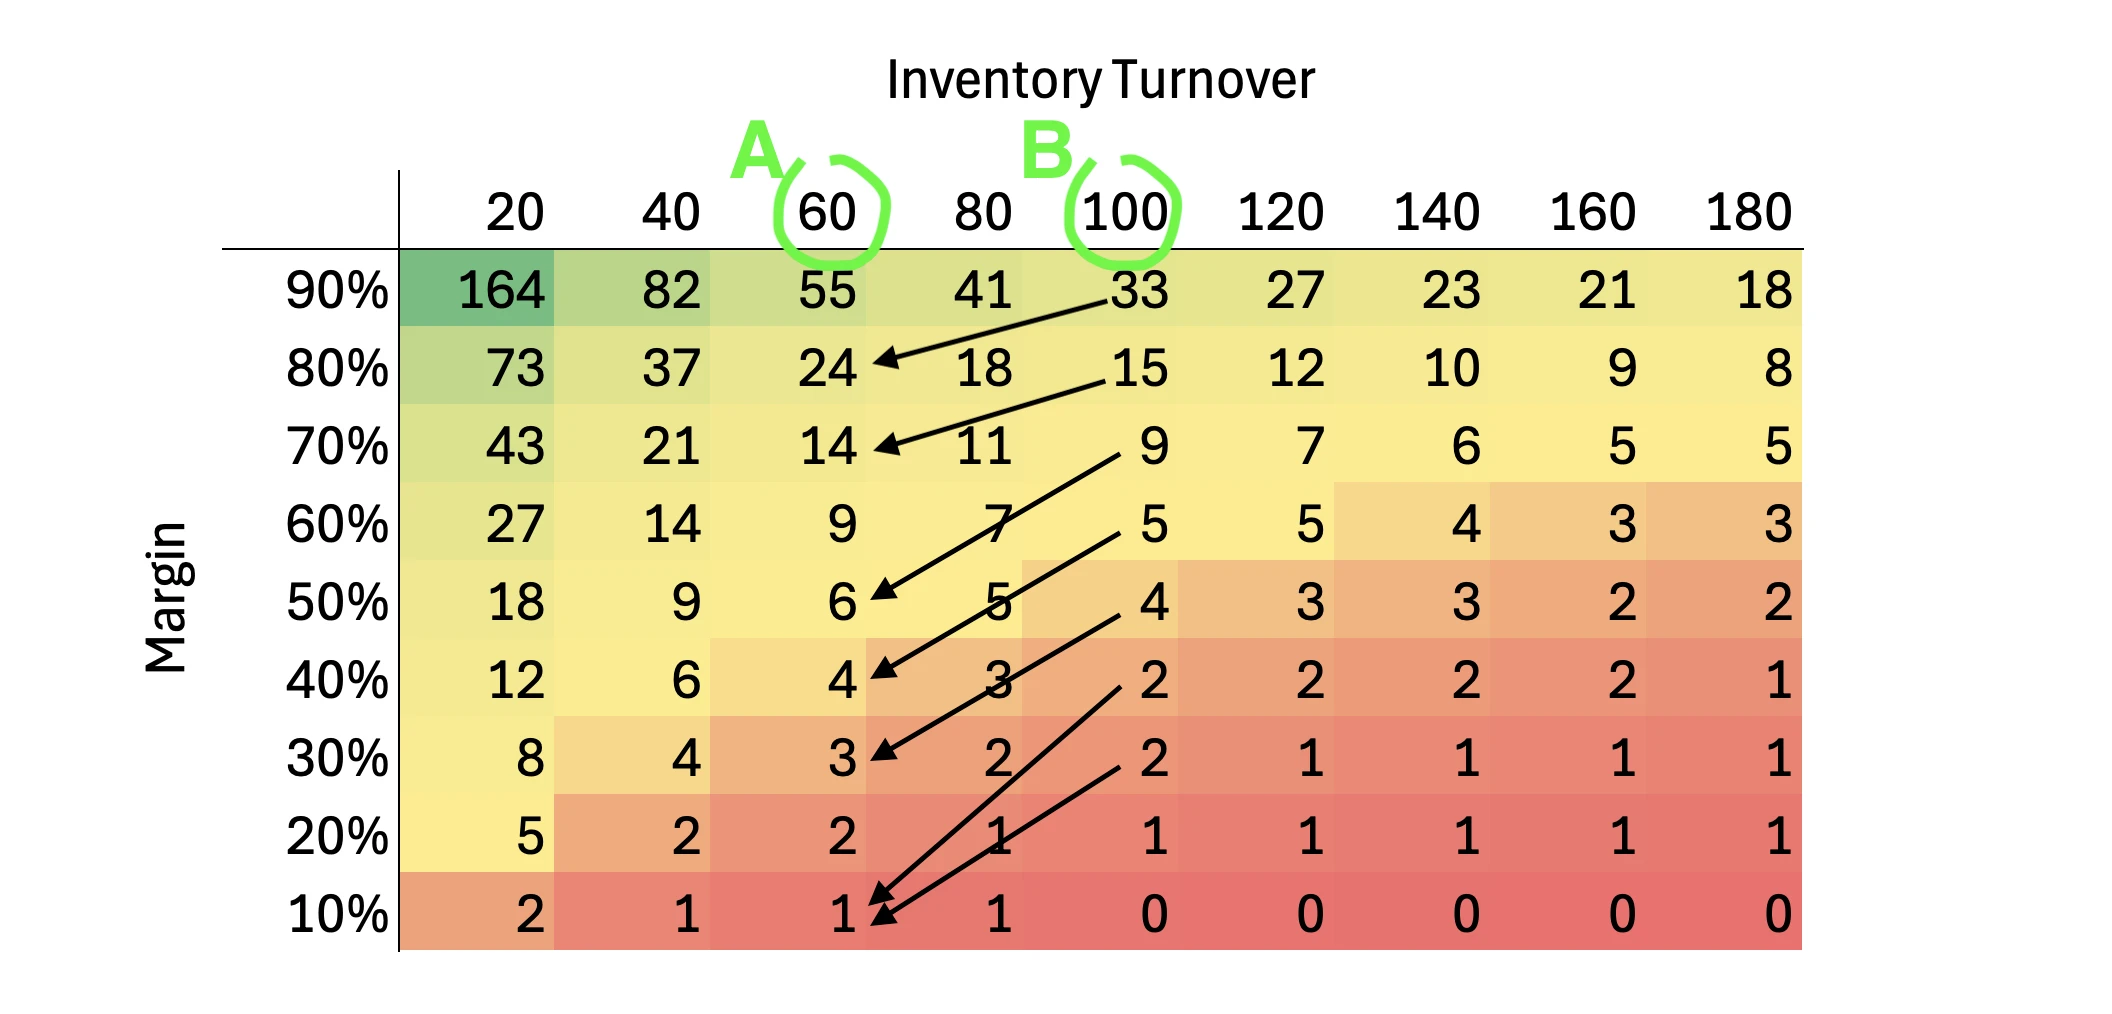
Inventory turnover (XYZ):
- •X (fast):20–60 days
- •Y (moderate):80–120 days
- •Z (slow):140–180 days
Then our matrix will look as follows:
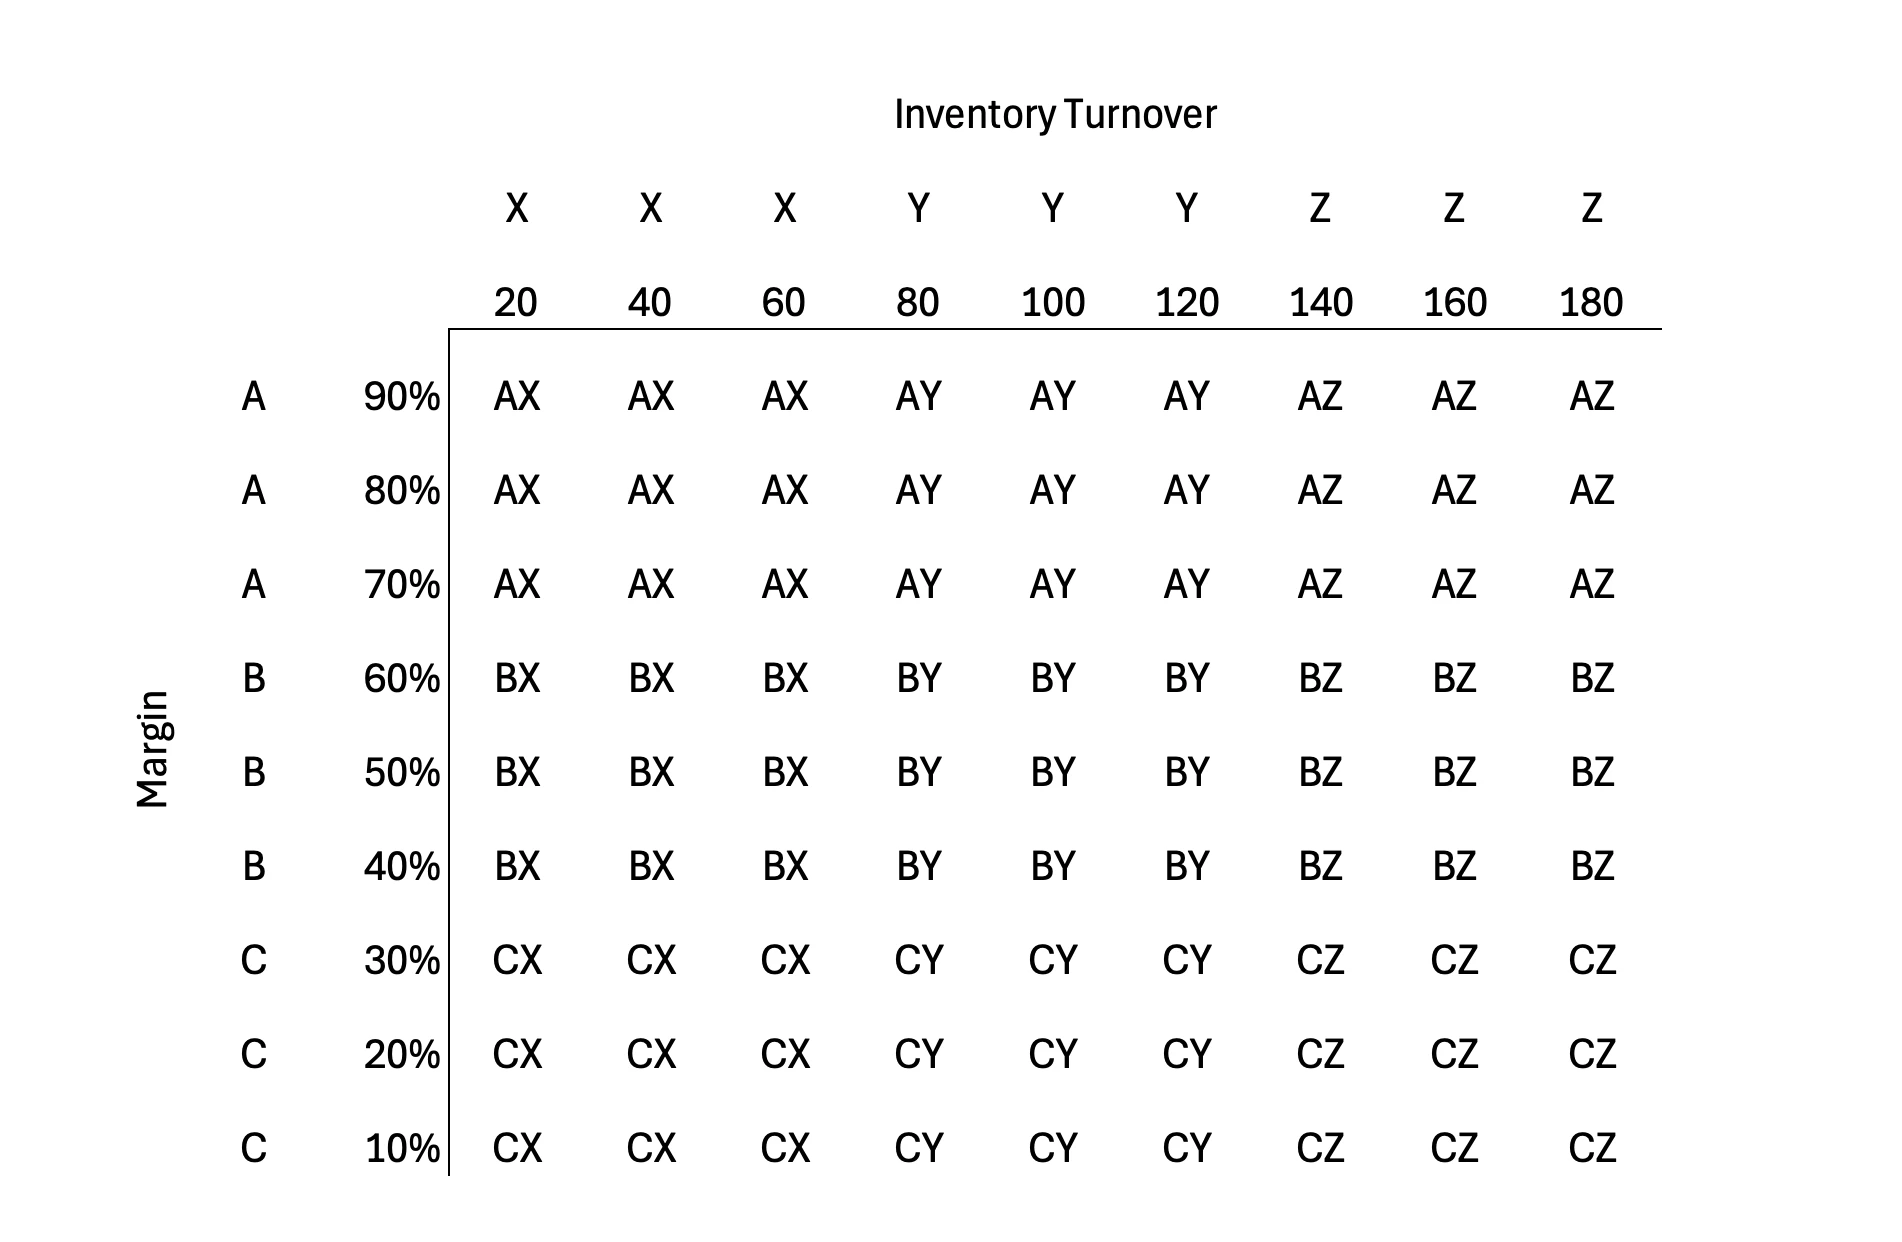
We can see that the combinations we examined earlier fall into different classes: BX and AZ. And despite the fact that they generate the same expected annual profit, the combination that falls into class AZ would be considered less attractive, solely because of an arbitrary classification.
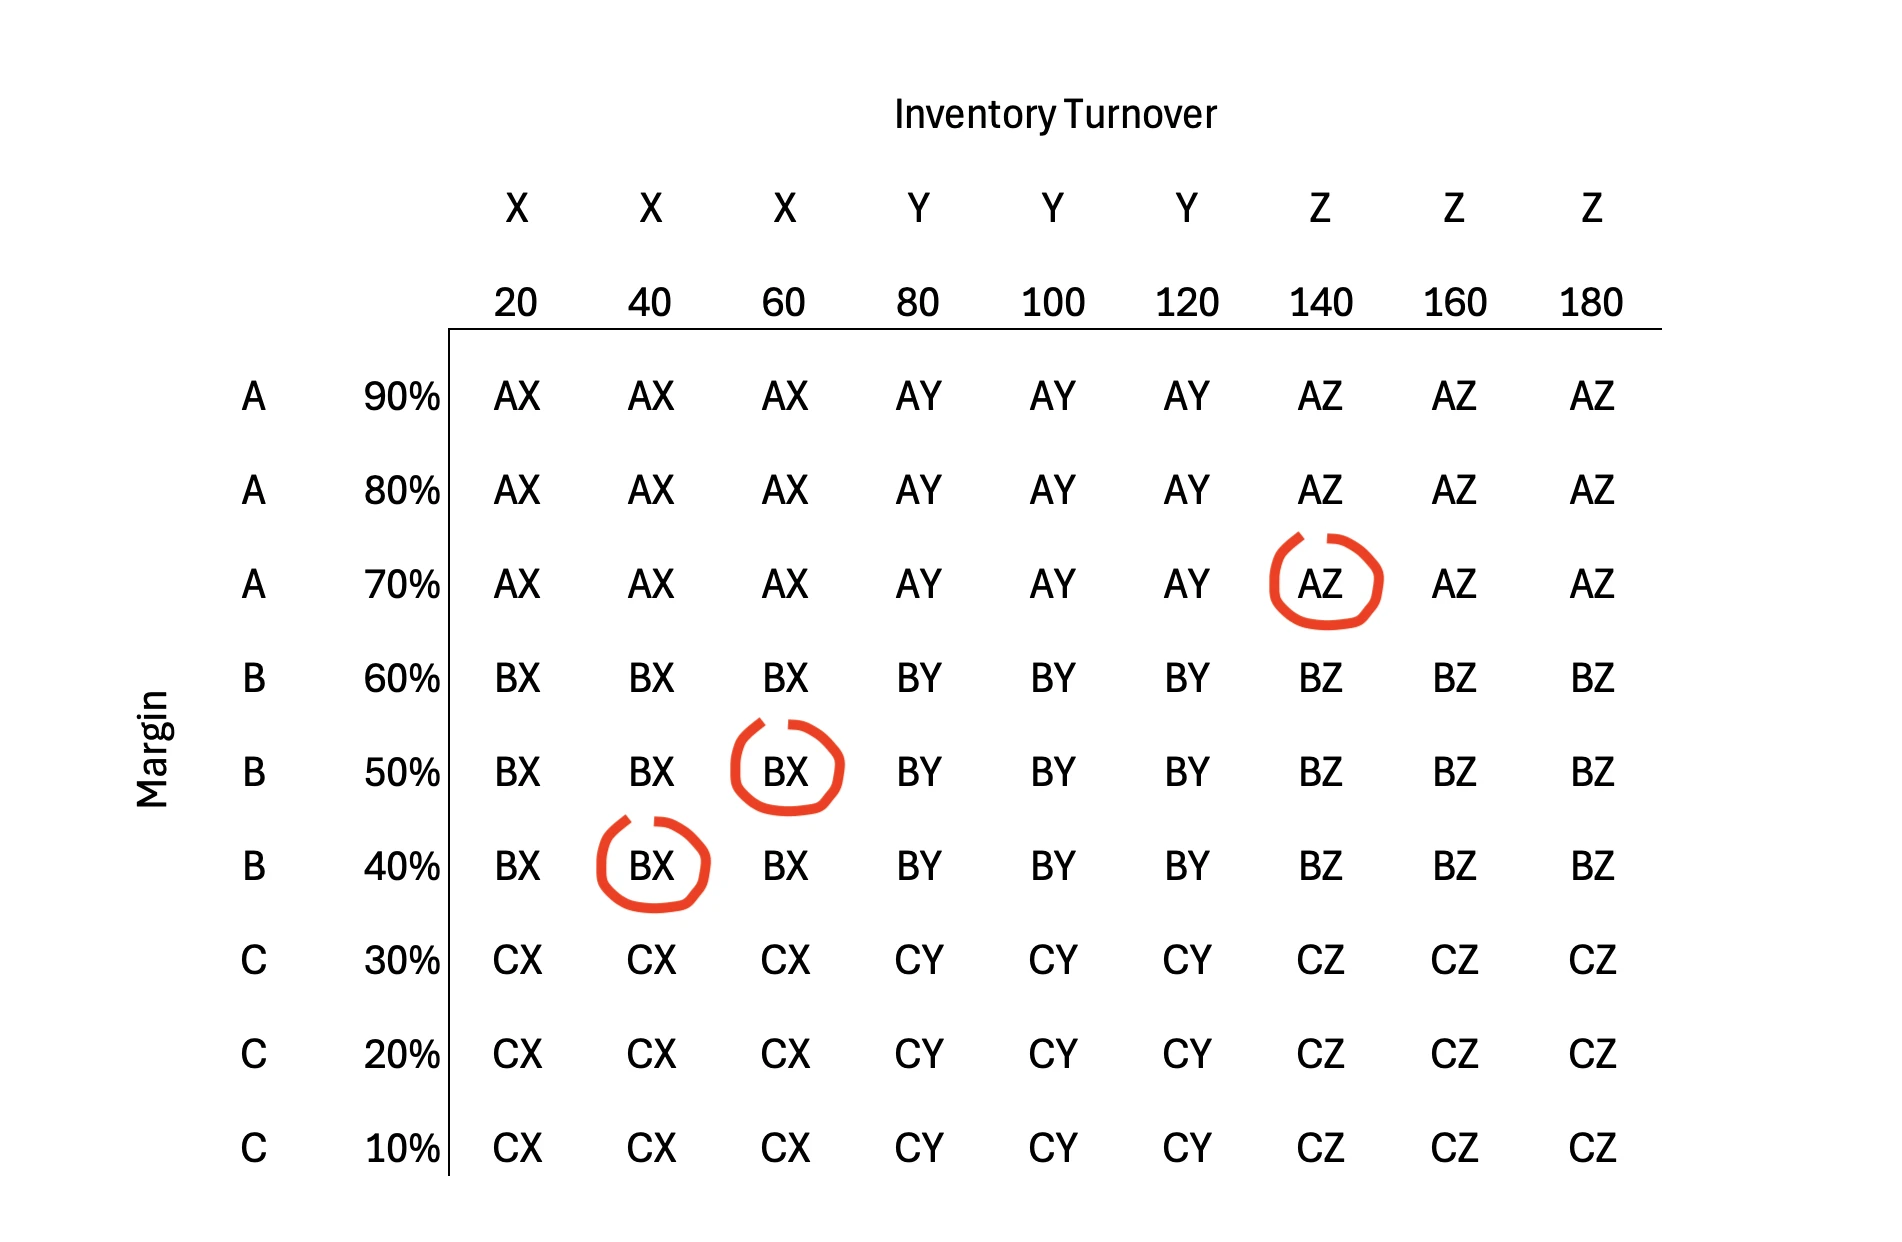
But the risks associated with the ABCXYZ approach become even more apparent if we look at class AX, which would certainly receive the most attention from sellers.
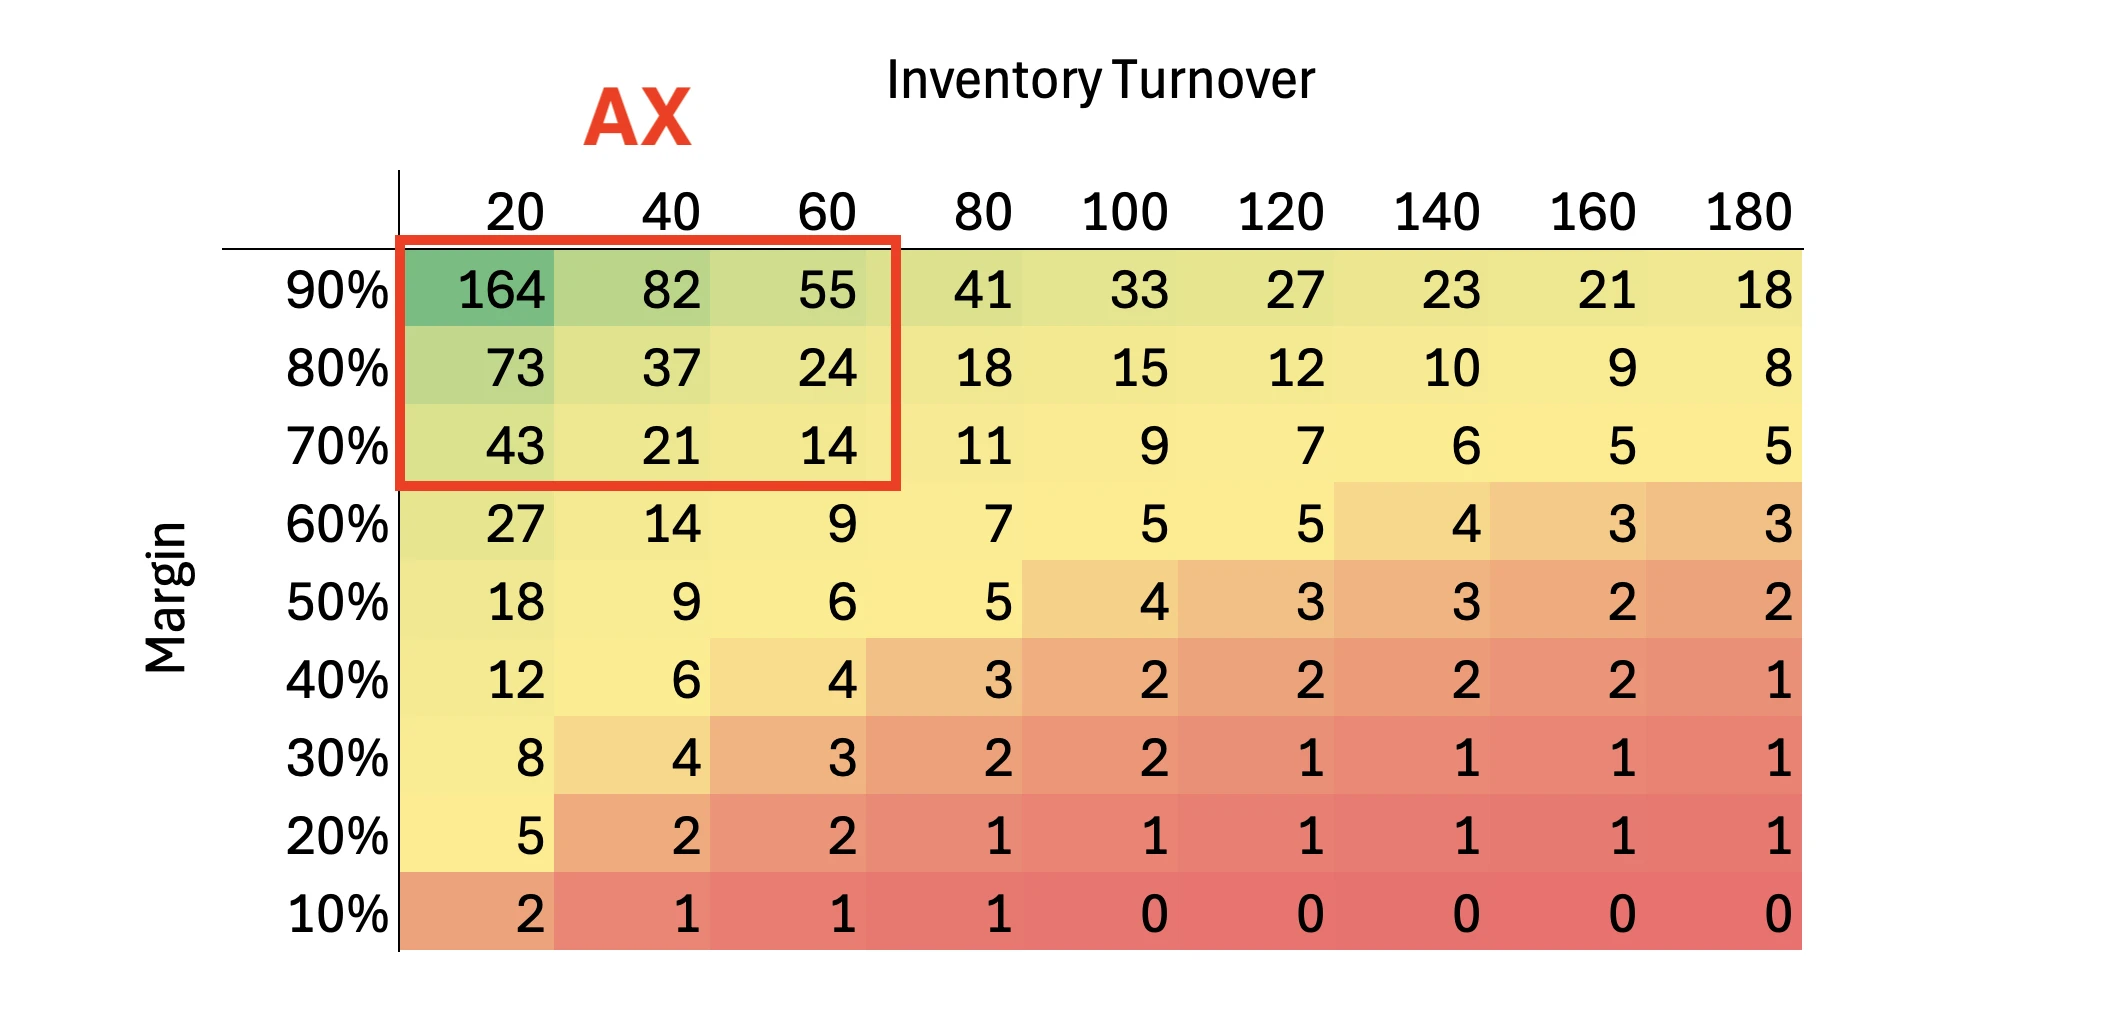
Inside class AX, for example, you may have products with expected profit 164 and with expected profit 14, or
- •a faster-turning (20 days) SKU with lower margin (70%) and expected profit 43,
- •a slower-turning (60 days) SKU with higher margin (90%) and expected profit 55.
Such high margins here are for illustration purpose only, to better show the risks.
ABCXYZ analysis approach puts both pairs into the same "high-priority" category, but it does not tell you which product deserves the next euro of investment when your budget is limited.
That final step, choosing between strong products with different turnover-margin profiles, is exactly where sellers need to evaluate the two options within one class.
This is the step ABCXYZ approach cannot perform.
The Core Problem: Margin And Turnover Are Evaluated Separately
Here is the issue I see repeatedly:
Turnover is treated as an operational metric.
Margin is treated as a financial metric.
And restock decisions rarely connect the two.
Margin without turnover tells you nothing about how effectively your capital works. Turnover without margin tells you nothing about the value created when the product is finally sold.
Most restock tools:
- •show margins,
- •but do not use them as a basis for recommendations.
Margins appear only as a reference, not as a deciding factor.
The restock tools optimize for stock availability and storage costs, not for capital allocation.
The result is predictable: they tell you what to reorder, but not whether that product is actually the best use of your money.
The better approach for replenishment decisions is to evaluate the joint contribution of margin and turnover to ROI and overall capital efficiency. In other words, to understand both profit and the speed at which investment in working capital returns covering your cost of capital.
Why Relying On "Universal Rules" Leads To Hidden Risks
Because tools and classifications don't connect margin and turnover, many sellers fall back on simple rules:
- •"Don't let items sit more than 60 days."
- •"Slow movers are risky."
- •"High-margin products are always better."
These rules are well-intentioned, but they are:
- •generalized,
- •empirical,
- •and not tailored to your specific SKU economics.
It is important to remember, that such rules can be helpful, but until they replace thinking.
Sellers shouldn't forget to ask essential questions:
- •Is the fast-moving SKU actually the best place to put capital?
- •Does this product generate enough value to justify a longer cycle?
- •What is the actual financial trade-off between margin and turnover?
Once you start asking these questions, you quickly realize that many "slow" SKUs are extremely attractive, and many "fast" SKUs are efficient operationally but not financially.
The Bottom Line
The conclusion I shared with my friend, and have shared many times with e-commerce teams is simple:
Margin and turnover only make sense when evaluated together.
Separately, each metric is incomplete.
Together, they show which products truly create value.
Restock tools help manage operations, but operational efficiency is not the same as financial efficiency.
And when capital is limited, the real question is not "What should I reorder to stay in stock?" but "Where should I invest my money to create the most value?"
In the next article, Lead Time as a Financial Variable: Why Buying "Cheaper" Can Cost You More (When You Pay in Advance), we'll look at why lead time, often treated as a purely operational parameter, is actually a major financial variable in capital allocation decisions.